Business Profitability Analysis: Explore Key Metrics and Financial Performance
Business profitability analysis is the process of examining a company's income, expenses, and financial results to understand how effectively it generates profit.
It helps explain the relationship between revenue and the resources used to earn it. By reviewing financial records and performance indicators, businesses can identify changes in profitability and understand the factors influencing their financial position.
Traditionally, profitability analysis relied on accounting records, spreadsheets, income statements, and manual calculations. As financial operations have become more data-driven, business profitability software and business financial analysis software have made it easier to organize financial information, compare reporting periods, and examine different parts of an organization.
Profitability analysis tools can help calculate profit margins, compare departmental results, and track changes in operating expenses. These tools may also connect information from accounting systems, sales records, inventory databases, and financial reports. The purpose is to provide a clearer picture of financial performance rather than relying on revenue figures alone.
Understanding Revenue, Expenses, and Profit
Revenue represents the income generated through business activities before expenses are deducted. Expenses include the amounts used for materials, employee compensation, rent, utilities, administration, transportation, and other operating requirements. Profit is the amount remaining after the relevant expenses have been accounted for.
A business can generate substantial revenue while maintaining a narrow profit margin if its expenses are also high. Conversely, a smaller organization may achieve a healthy margin when its operating expenses remain proportionate to its income. Business profitability analysis examines these relationships to provide context for financial results.
Common Profitability Metrics
Several financial metrics are used to assess profitability:
Gross profit margin measures the proportion of revenue remaining after direct production or purchasing expenses.
Operating profit margin measures operating profit as a percentage of revenue.
Net profit margin measures the proportion of revenue remaining after all applicable expenses, including interest and taxes.
Return on assets examines how effectively a business uses its assets to generate earnings.
Return on equity measures earnings in relation to shareholders' equity.
Each metric answers a different question. Reviewing several indicators together provides a broader understanding of financial performance.
Importance
Business profitability analysis matters because financial performance affects an organization's ability to maintain operations, manage obligations, plan investments, and respond to changing market conditions. It is relevant to small businesses, established companies, financial managers, business owners, and analysts who need to understand how income and expenses interact.
Revenue growth alone does not necessarily indicate stronger financial performance. Increasing material expenses, operating overhead, borrowing costs, or inventory losses can reduce the amount of profit retained. Profitability analysis helps make these relationships more visible.
Identifying Changes in Financial Performance
Comparing financial results across months, quarters, or years can reveal patterns that may require further examination. For example, revenue might increase while the net profit margin declines. This could indicate higher operating expenses, changes in product mix, increased financing expenses, or other factors affecting earnings.
Business financial analysis software can organize these comparisons into reports and dashboards. However, the results depend on accurate accounting records and consistent reporting methods.
Supporting Planning and Resource Allocation
Profitability information can help organizations evaluate departments, product categories, locations, and individual projects. A business may discover that one activity contributes a larger share of operating profit while another requires substantial resources relative to its financial contribution.
Such findings provide context for budgeting and planning. They do not automatically determine which activities should continue, because strategic value, customer needs, long-term investment, and operational requirements may also matter.
Understanding Profit Margins
Profit margin analysis software can help calculate and compare margins across reporting periods or business segments. For example, if revenue increases but expenses rise more quickly, the margin may decline even when total sales are higher.
The following table illustrates how revenue and profit relate to common margin calculations. The figures are hypothetical and are provided only to explain the calculations.
| Financial measure | Example amount | Meaning |
|---|---|---|
| Revenue | $100,000 | Income before expenses |
| Direct expenses | $60,000 | Expenses directly related to goods or production |
| Gross profit | $40,000 | Revenue minus direct expenses |
| Operating expenses | $25,000 | Other operating expenses |
| Operating profit | $15,000 | Gross profit minus operating expenses |
| Net profit | $8,000 | Profit after applicable remaining expenses |
| Net profit margin | 8% | Net profit divided by revenue, multiplied by 100 |
These figures demonstrate why it is important to distinguish gross profit, operating profit, and net profit. Each measure reflects a different stage of financial performance.
Recent Updates
From 2024 through 2026, business profitability analysis has increasingly incorporated automated reporting, cloud-based accounting systems, predictive analytics, and artificial intelligence. These developments reflect a broader shift toward reviewing financial information more frequently and combining data from multiple business functions.
Automation and Integrated Financial Reporting
Modern business profitability software can connect with accounting platforms, enterprise resource planning systems, and financial databases. Depending on the software, this integration can reduce repetitive data entry and help maintain consistent reporting across departments.
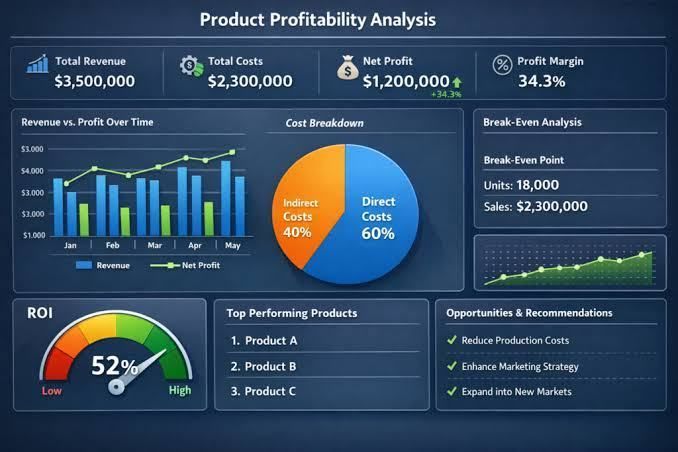
Automated dashboards may display revenue, expenses, margins, and changes over time. Data synchronization and reporting rules still require oversight because incomplete records, duplicate entries, or inconsistent classifications can affect the results.
Artificial Intelligence and Predictive Analysis
AI-supported financial analysis can help identify unusual expense patterns, summarize financial reports, and estimate possible future outcomes using historical information. Some systems can also compare actual results with budgets and highlight significant differences.
Predictive analysis is not a guarantee of future performance. Changes in demand, interest rates, regulations, supplier conditions, and other external factors may cause actual results to differ from estimates.
Greater Attention to Data Quality and Security
As financial tools become more connected, organizations must consider access permissions, data protection, audit trails, and the reliability of information shared between systems. Financial reports may contain confidential business details, making appropriate access controls important.
Organizations also need to understand how calculations are defined within their chosen platforms. Differences in expense classification, reporting periods, or accounting methods can make comparisons misleading when they are not addressed.
Tools and Resources
Different resources can support profitability calculations, financial reporting, and performance monitoring. The appropriate option depends on the size of the organization, the complexity of its records, and the questions being examined.
Spreadsheets and Financial Calculators
Spreadsheet applications can organize revenue and expense records, calculate margins, and compare financial periods. Templates may include income statements, budget-versus-actual reports, expense breakdowns, and profitability summaries.
A basic net profit margin calculation is:
Net profit margin = (Net profit ÷ Revenue) × 100
For example, a company with $12,000 in net profit and $150,000 in revenue has a net profit margin of 8%. This calculation is useful for understanding the proportion of revenue retained as net profit.
Business Profitability Software
Business profitability software may combine accounting information, cost allocation, financial reporting, and performance dashboards. Some platforms support analysis by department, project, location, or product category.
When reviewing these tools, relevant considerations include reporting flexibility, integration with existing accounting records, calculation transparency, data access controls, and the ability to export information for further analysis.
Profitability Analysis Tools and Reference Materials
Profitability analysis tools may include margin calculators, financial statement templates, budgeting worksheets, and scenario analysis models. Educational materials from accounting organizations, financial regulators, and established accounting software documentation can also explain common financial terms and reporting practices.
Profit margin analysis software can simplify repeated calculations, but the interpretation of results still depends on the business context. Unusual results may require checking the underlying records and reviewing how expenses have been classified.
FAQs
What is business profitability analysis?
Business profitability analysis examines revenue, expenses, and earnings to understand how effectively a business generates profit. It commonly uses profit margins, operating results, and returns on assets or equity.
How does business profitability software work?
Business profitability software organizes financial data and applies calculations to produce reports, comparisons, and dashboards. Its features vary, but many systems help track revenue, expenses, margins, and financial performance over time.
Which profitability analysis tools are commonly used?
Common tools include spreadsheets, accounting platforms, financial calculators, reporting dashboards, and budgeting templates. More advanced platforms may support automated reporting and analysis across departments or projects.
What does profit margin analysis software measure?
Profit margin analysis software can calculate gross, operating, and net profit margins. These measurements show how much revenue remains at different stages after relevant expenses are deducted.
Why is business financial analysis software useful?
Business financial analysis software helps organize financial records, compare reporting periods, and examine differences between budgets and actual results. The accuracy of its findings depends on the quality of the underlying data and the methods used.
Conclusion
Business profitability analysis provides a structured way to understand the relationship between revenue, expenses, and earnings. Metrics such as gross profit margin, operating profit margin, and net profit margin reveal different aspects of financial performance. Business profitability software and related analysis tools can support reporting, comparisons, and financial planning when used with accurate records. Automated reporting and AI-based analysis are expanding these capabilities, while data quality, security, and careful interpretation remain important.